


Fix your product copy first. That single change delivers more revenue per visitor than any increase in ad spend — and roughly 20% of purchase abandonments trace back to insufficient or unclear product information. Start in the next 72 hours by auditing your top three SKUs for these three things:
- Hero image: lifestyle shot, not a white-background spec photo
- Benefit-led highlights: 3–5 bullets at a 7th-grade reading level, each under one line on mobile
- Sticky CTA: always visible on scroll, high-contrast, uncluttered
Rewrite those three elements on your highest-traffic product page before anything else. Merchup AI’s AI-powered description templates are built around exactly this structure, so you can apply the same pattern across hundreds of SKUs without starting from scratch each time.
Why product pages are your highest-leverage conversion surface
Every pound you spend on traffic lands on a product page. If that page fails, the click is wasted. Only 49% of ecommerce sites deliver a good user experience on product detail pages, despite those pages being where purchase decisions are made.
The economic case is straightforward. Take a store with 50,000 monthly product page visits, an average order value of £65, and a current conversion rate of 2%. A lift to 2.6% adds a significant increase in monthly revenue even without additional visitors. That is the compounding logic behind prioritising product page work over more ad spend.
Mobile accounts for a majority of traffic yet converts at a noticeably lower rate than desktop. That gap is almost entirely caused by avoidable friction: oversized hero images pushing the CTA below the fold, slow load times, and copy written for a desktop reader. Page speed compounds everything else. Even a 0.1–1.0 second improvement in load time can produce measurable conversion lifts, which is why performance fixes belong in the same sprint as copy changes, not a separate engineering backlog.
What does a high-converting product page actually look like?
Think of the product page as a sales environment, not a spec sheet. Every element should reduce buyer uncertainty. Here is a grouped checklist of the highest-impact changes, ordered by zone.
Above the fold
- Use-case label above the product title (“For Dry, Sensitive Skin” or “Post-Workout Recovery”)
- Outcome-led headline sentence: lead with the result, not the ingredient
- Price zone with per-unit cost breakdown (“£28 / 200ml = 14p per use”)
Imagery
- Sequence: lifestyle hero → detail angles → scale reference → UGC photo. Stores following this sequence typically experience 20–30% higher add-to-cart rates.
- Overlay a credible result claim on the hero image, backed by a real study or survey
- Link variant images to colour/size selectors so shoppers never have to guess
Copy
- 3–5 benefit bullets immediately above the Add to Cart button, each a single line on mobile
- 7th-grade reading level throughout; cut any sentence that requires re-reading
Social proof
- Star rating and review count near the product title, not buried below the fold
- UGC photos in the gallery; reviews and user-generated content are among the most influential conversion elements after imagery
Trust and payments
- Delivery time and cost immediately below the CTA (“Free next-day delivery on orders over £30, order before 3pm”)
- BNPL or instalment pricing alongside the full price for higher-AOV products; this typically lifts add-to-cart rates by 8–12% for relevant price points
- Icon strip: “30-Day Returns,” “Made in UK,” “Secure Checkout”
Mobile
- Sticky Add to Cart button, always visible on scroll
- Reduce hero image height by 15–20% on mobile viewport to bring the CTA into view sooner
- Tile-format quantity selector with large tap targets
Pro Tip: Authentic scarcity converts; manufactured scarcity destroys trust. “Only 4 left in stock” works when it is true and verifiable. A fake countdown timer does the opposite. The same principle applies to delivery cut-offs: show the real order-before time, not a static “order today” message.
How do you measure impact and run data-first tests?
Run diagnostic heatmaps and an impact-vs-effort triage before touching anything at scale. Intuition about what is broken is almost always wrong. VWO’s guidance is clear: diagnose with heatmaps and session replays first, then test.
The primary metrics to track are add-to-cart rate, product page conversion rate, revenue per visitor, and cart-to-purchase rate. Bounce rate and time on page are useful diagnostics but not primary KPIs. A simplified page that converts faster will often show a shorter time on page alongside a higher conversion rate — that is a win, not a problem.
For sequencing, practitioners use an impact-vs-effort matrix to prioritise changes. Sticky Add to Cart, upfront delivery messaging, and price transparency consistently land in the “test first” quadrant: high impact, low engineering cost. Redesigning the entire page layout sits at the other end.
Testing discipline matters as much as test selection. One variable per test. Run each test until you reach statistical significance — typically 95% confidence and a minimum of 100–200 conversions per variant. Resist the urge to call a test early because the early data looks good.
Pro Tip: Run a Lighthouse or Core Web Vitals audit before any creative A/B test. If your Largest Contentful Paint is above 2.5 seconds, a speed fix will likely outperform any copy change. Isolate performance variables first so your creative tests are not contaminated by load-time noise.
How to scale product description optimisation using AI
AI reduces per-SKU content time while keeping conversion-tested templates consistent across a catalogue. The economics shift significantly: what takes a copywriter 20–30 minutes per product can be batched in seconds, with a human edit pass reserved for quality control rather than first-draft creation.
A practical AI-plus-human workflow runs like this: build a template that encodes your editorial rules (benefit-led structure, 7th-grade reading level, outcome sentence first), generate a batch of descriptions, run a human edit pass on the top 10% of SKUs by traffic, then publish. The template is the quality gate, not the individual writer.
Operational guardrails to build in from the start:
- Version-control your templates so you can roll back if a new variant underperforms
- Assign each batch to a testing cohort so you can measure uplift against the previous version
- Enforce the benefits-first rule at the template level, not as a post-edit instruction
- Use visual merchandising principles to inform how you sequence information within each description
For Shopify operators, the integration layer matters as much as the generation layer. Bulk-publish directly to your catalogue, avoid manual copy-paste that introduces drift, and keep metadata (title tags, meta descriptions) in sync with the body copy. An AI tool worth using should offer custom templates, a visual editor, a publishing queue, and analytics hooks so you can close the loop between content changes and conversion data.
Your practical 30/60/90 day rollout plan
A staged rollout reduces risk and delivers measurable lifts within 30–90 days. Most stores see meaningful movement on quick wins within four to eight weeks.
| Phase | Focus | Key actions |
|---|---|---|
| Days 1–30 | Audit and quick wins | Audit top 10 SKUs; add sticky CTA; surface delivery and returns info; fix hero images; rewrite benefit bullets |
| — | Test and expand | A/B test key hypotheses on top SKUs; expand improved templates to 30–100 SKUs; collect and surface review UGC |
| — | Automate and scale | Roll out AI-generated descriptions across catalogue segments; integrate bulk publishing with Shopify; set up continuous testing roadmap |
Budget note: Quick wins in days 1–30 require minimal spend — mostly time. The 60-day phase may involve an A/B testing tool subscription (tools like VWO or similar platforms typically start from a few hundred pounds per month). The 90-day AI scaling phase is where a tool like Merchup AI pays for itself: the cost per description drops sharply at volume, and the Shopify integration removes the manual publishing overhead entirely.
For the 30-day sprint specifically, prioritise in this order:
- Fix the hero image on your top three products by traffic
- Add sticky CTA and delivery clarity on mobile
- Rewrite benefit bullets to lead with outcomes, not features
- Surface returns policy and trust icons near the CTA
The part most operators get wrong
Most ecommerce teams treat product page work as a one-off project rather than an ongoing testing programme. They fix the obvious things — a blurry hero image, a missing returns policy — and then move on. The stores that compound gains over time are the ones that treat every template change as a hypothesis, measure it, and feed the result back into the next iteration.
The AI question is real but often framed badly. The risk is not that AI-generated descriptions are low quality; with the right template and editorial rules, they are consistently better than the rushed manual copy most catalogues contain. The risk is deploying at scale without a measurement loop. Generate, publish, measure add-to-cart movement, iterate the template. That sequence is what separates AI as a productivity tool from AI as a liability.
Speed matters too. A store that ships 10 imperfect tests per quarter will outperform one that ships two perfect ones. The 30/60/90 framework exists precisely to force that cadence.
Fewer descriptions, more conversions: how Merchup AI fits in
Writing benefit-led, SEO-optimised copy for hundreds of products is the bottleneck most Shopify teams hit around the 60-day mark. Merchup AI removes it.
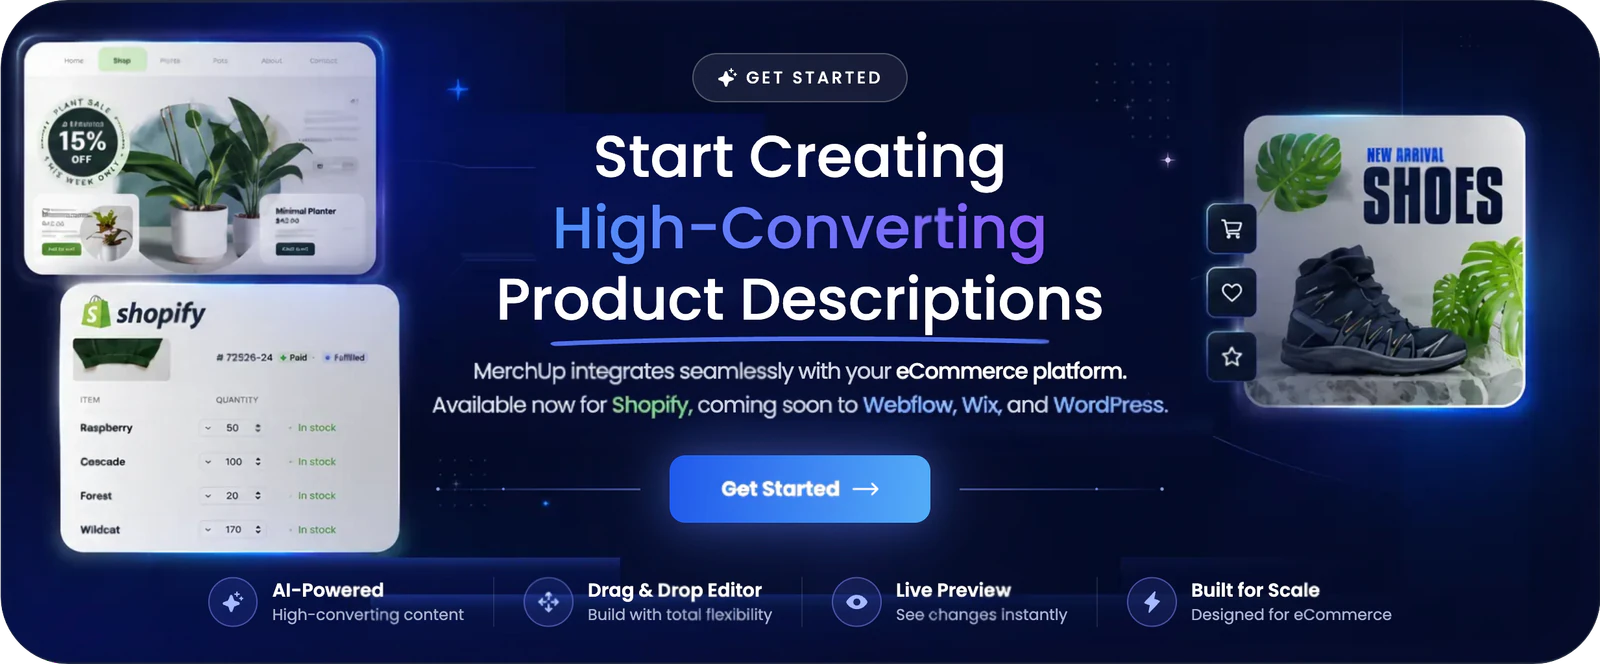
The platform generates, edits, and bulk-publishes product descriptions directly to Shopify, using conversion-tested templates that encode the benefit-led structure, 7th-grade reading level, and outcome-first framing described throughout this article. The visual editor lets you adjust tone, structure, and SEO metadata without touching code. Activity tracking and real-time catalogue management mean you always know which descriptions are live and which are queued for testing.
The sensible trial path: pilot 50 SKUs, measure add-to-cart rate over four weeks against your previous copy, then scale to the full catalogue once the uplift is confirmed. View Merchup AI’s plans and pricing to find the right tier for your catalogue size, or explore the full feature set before committing.
Useful sources
- Product page optimisation — ConversionStudio
- The complete guide to building a high-converting product page in 2026 — D2C Times
- Ecommerce product page design — VWO
- Product page conversion: the analytics behind pages that sell — Kissmetrics
- Ecommerce product page optimisation: 2026 framework — Digital Applied
- CRO for D2C: 10 PDP changes that move the needle — LaunchGPTs
- Product page conversion engineering — ScaledByDesign
- Boost sales with product page optimisation — Shopify
- Visual merchandising signage: your 2026 retail guide — CrispSign
- Merchup AI — AI product description generator and editor


Comments
No comments yet — be the first to share what you think.