


Product description analytics means tracking how your listing copy affects discovery, clicks, and purchases, then acting on what the numbers show. Start by checking purchase conversion rate or revenue per visit, alongside add-to-cart rate and time on page, for your worst-converting, highest-traffic SKUs. Run a quick audit of your top 10 to 20 listings this week before touching anything else.
TL;DR:
- Test purchase conversion rate for short-cycle SKUs and revenue per visit for higher-priced, wider-spread catalogs, focusing on high-traffic listings first.
- Run A/B tests with clear hypotheses, ensuring enough traffic, a full cycle, and proper tracking setup before implementing changes.
- Watch for mixed signals like rising add-to-cart without purchase or increased time on page without conversion, and address underlying checkout or confusion issues.
- Use customer support logs and reviews to identify real objections for copy improvements rather than relying on guesses or assumptions.
- Automate content updates with AI tools to quickly scale proven description changes across similar SKUs once testing confirms effective.
Core KPIs and a scorecard for tracking product performance metrics
Chasing one number gets you into trouble. A description can lift add-to-cart rate while purchases stay flat, or push time on page up because shoppers are confused rather than engaged. ConvertLab’s testing framework recommends a primary metric such as purchase conversion rate, backed by secondary diagnostics like add-to-cart rate and time on page, which together give a far more honest read than any single figure.
Pick your primary metric based on the SKU, not habit. Purchase conversion rate works well for standalone products with a short buying cycle. Revenue per visit suits catalogues with wide price spreads, where a description might sell fewer units at a higher basket value and still win.
A workable scorecard has four to six items, refreshed weekly for high-traffic SKUs and monthly for the long tail:
- Purchase conversion rate (primary)
- Revenue per visit (primary alternative)
- Add-to-cart rate (early buying-intent signal)
- Time on page and scroll depth (engagement without conversion)
- Refund rate and support contacts (post-purchase friction)
Statistic to watch: ConvertLab notes that testing one clear variable at a time against a primary revenue metric tends to produce compounding gains you can carry across similar SKUs, rather than a one-off win on a single listing.
Keep the scorecard visible somewhere the whole listing team checks weekly, not buried in a quarterly report nobody opens.
Designing A/B tests to prove a description change works
A hunch that new copy “reads better” is not a test. You need a hypothesis, a primary metric, and a guardrail before you touch a live listing.
- Write the hypothesis properly. Use the structure: change → mechanism → primary metric → guardrail. For example: “Adding a benefit-led opening line (change) reduces buyer hesitation about fit (mechanism), which should raise purchase conversion rate (primary metric), without increasing refund rate (guardrail).”
- Check you have enough traffic. A listing pulling under a few hundred sessions a week will take months to reach a usable sample. Prioritise SKUs with real volume, not your favourite product.
- Run for at least one full business cycle. ConvertLab and the Rework playbook both point to a minimum of two weeks, and ideally a full weekly cycle including weekends, to avoid a test that just happened to catch a payday spike.
- Set your minimum detectable effect before launch. Decide upfront whether a 2% lift matters to your margins, or whether you’re only interested in something closer to 10%. This stops you calling a result early out of impatience.
- QA the tracking before you QA the copy. Confirm sessions attribute correctly to orders, exclude staff and internal IP traffic, and check that both variants load identically on mobile. A broken add-to-cart button on one variant will wreck the whole test and you won’t know until the numbers look strange.
Pro Tip: Screenshot both variants side by side before launch and get a second person to check them blind. Teams regularly discover the “control” and “test” pages are accidentally identical, or that a template swap silently broke the price display on one version.
Arlo’s guidance on sourcing language from reviews, support tickets, and on-site search applies directly here. A hypothesis grounded in something a real customer actually said in a support ticket outperforms a hypothesis based on what your team assumes shoppers want.
Reading mixed signals and turning results into action
Metrics rarely move in one clean direction, and that’s normal. Three patterns come up constantly.
- Add-to-cart rises, purchases don’t. Usually a checkout friction or pricing surprise problem, not a description problem. Check shipping cost disclosure and payment options before touching the copy again.
- Time on page rises, conversion stays flat. This often means confusion, not engagement. Long paragraphs that read well to a copywriter can just mean shoppers are hunting for a spec they can’t find.
- Conversion rises, average order value falls. Check whether the new copy is winning price-sensitive shoppers at the expense of upsell attach. Not necessarily bad, but you need to know which trade-off you’re making.
Guardrails exist to catch the trade-offs a headline metric misses. Anglera’s ROI framework recommends tracking refund rate and support contact volume alongside conversion, because a description that oversells a product will often win short-term conversion and lose it back through returns within weeks.
Pro Tip: Don’t judge a test purely on day one results. A spike in refund rate typically lags a copy change by two to three weeks, once the first wave of orders has actually arrived and been used.
Before rolling a winning variant out to your full catalogue, run through this checklist:
- Document the hypothesis, result, and guardrail movement somewhere the whole team can find it later
- Roll out to a second, comparable SKU segment before going catalogue-wide
- Set a monitoring window (two to four weeks) to watch refund rate and support contacts post-rollout
- Define rollback criteria in advance, such as a refund rate rise beyond an agreed threshold
Tools and integrations that connect analysis to action
Most of the data you need already exists across two or three platforms. Google Analytics 4 gives you conversion rate, revenue per visit, and session paths. Google Search Console shows click-through rate and ranking position for the exact query terms shoppers use to find each listing. Your ecommerce platform’s own revenue reports handle attribution and refund tracking. Consistent URL tagging across all three matters more than most teams realise, because a mismatch is usually why conversion numbers in GA4 don’t match your Shopify dashboard.
For testing, Shopify’s own theme and app ecosystem lets you run simple split traffic or sequential before/after tests without custom development, particularly useful for smaller catalogues that can’t justify a dedicated experimentation platform.
The bottleneck for most teams isn’t measurement, though. It’s the gap between “we know this description needs rewriting” and the copy actually going live. Content workflow tools that connect directly to your storefront close that gap. MerchUp AI, for instance, applies templates and a visual editor so a winning variant identified in testing can be drafted, edited, and published to Shopify without a separate export/import step, which matters when you’re trying to roll a result out across dozens of similar SKUs quickly. Pairing analytics with structured product page SEO keeps the copy discoverable while it’s converting.
Benchmarking product description performance against industry standards
There’s no single universal benchmark for “good” product description conversion, because it varies wildly by category, price point, and traffic source. What you can benchmark reliably is your own catalogue against itself, and your category against known patterns.
Metricuno’s research on rewriting manufacturer copy documents consistent conversion lifts across many verticals when generic manufacturer text is replaced with benefit-led, scannable copy structured for mobile reading. That’s a more useful benchmark than a flat industry-wide percentage, because it tells you what’s achievable through description work alone, isolated from pricing or promotional effects.
A practical benchmarking approach: group your SKUs by category and price band, then rank each group by conversion rate. The gap between your best and worst performer within the same category, same price band, and similar traffic quality is your real opportunity. If your top hiking boot converts at three times the rate of a near-identical model at a similar price, the description is the most likely lever, not the product itself.
For SEO benchmarking specifically, Rework’s playbook points to unique copy length, schema markup presence, and meta description quality as the factors search engines reward with better click-through. Run a quick audit of how many of your product pages still use manufacturer-supplied text verbatim. This is usually the fastest, cheapest fix available, and it also protects you from duplicate content issues that can quietly suppress rankings across an entire category.

What optimisation based on analytics actually looks like in practice
The clearest pattern across documented description rewrites isn’t a dramatic creative overhaul. It’s a targeted fix aimed at a specific, measurable hesitation.
Anglera’s ROI framework describes using holdout control groups to isolate the incremental revenue from improved product data, rather than crediting a whole seasonal sales bump to a copy change that happened to launch the same week. That distinction matters for anyone reporting results upward: a holdout segment that never received the new description gives you a clean baseline to compare against, so you’re not just measuring “sales went up,” you’re measuring “sales went up more than they did for the control group.”
Arlo’s guidance on mining reviews and support tickets for language shows up repeatedly as the difference between a rewrite that works and one that doesn’t. A description built from an actual recurring support question, such as confusion over sizing or material composition, tends to outperform a creative-first rewrite because it answers a hesitation that’s already been proven to exist rather than one the copywriter is guessing at. The pattern holds across categories: apparel sizing questions, electronics compatibility questions, and homeware dimension questions all follow the same fix, pull the real objection from support logs, address it in the first two lines of copy, then measure whether add-to-cart and conversion move together.
A working checklist for scaling description testing
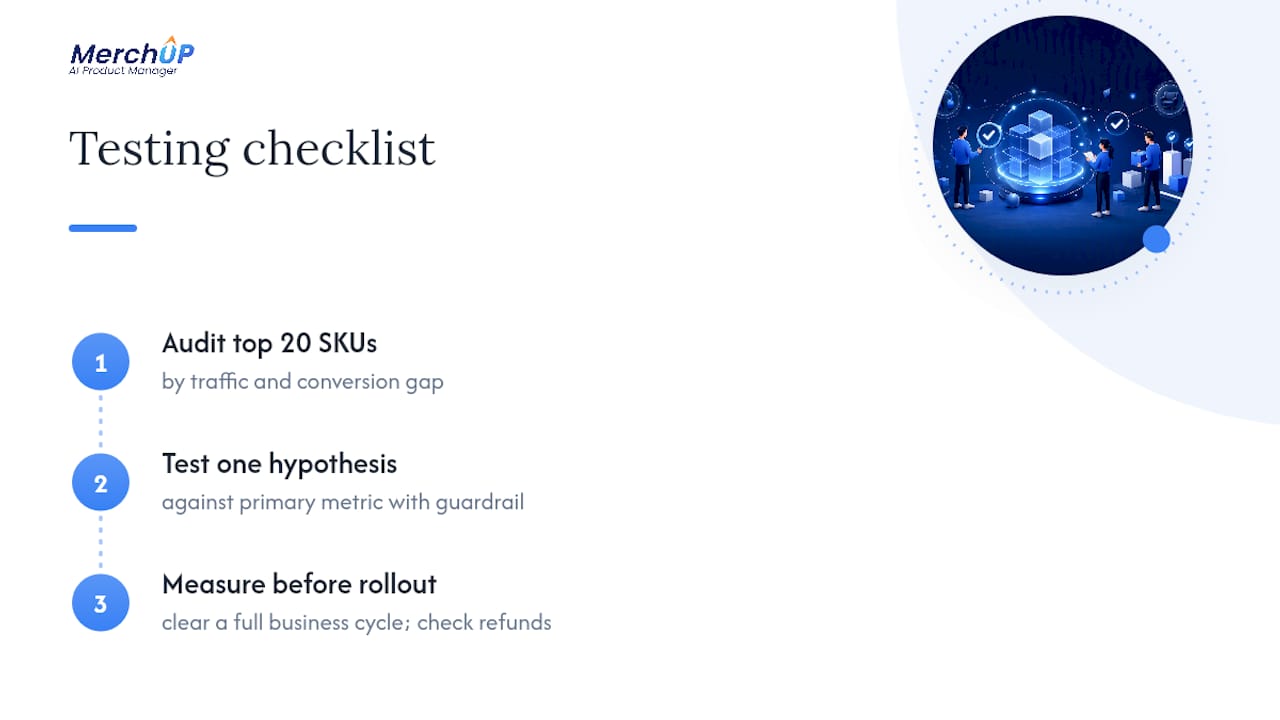
Three steps carry most of the weight: audit your top 20 SKUs by traffic and conversion gap, test one hypothesis at a time against a primary metric with a guardrail attached, then measure and roll out only once you’ve cleared a full business cycle and checked refund rate hasn’t quietly moved against you.
The pitfall teams hit when scaling this beyond a handful of listings is testing five copy changes on one page at once, then wondering which one actually worked. Isolate variables or you’ll waste weeks of traffic learning nothing you can repeat.
The other pitfall is treating a single successful test as proof it’ll work everywhere. It’s a starting hypothesis for the next SKU, not a guarantee.
— Jamie Moss
Turn testing insights into published listings faster with MerchUp AI
AI-powered tools can help automate rewriting and uploading winning variant listings in bulk. Once your testing has told you what works, such a tool can turn that insight into published copy across your whole catalogue more quickly than manual rewriting, using templates built around structures that tend to convert and a visual editor that keeps formatting consistent across many listings.

Integration with platforms like Shopify means a template applied to one winning SKU can be rolled out to a comparable segment without exporting spreadsheets or briefing a copywriter on each variant individually, which is exactly the incremental rollout step the testing checklist above calls for. If you’re ready to see how quickly a batch of descriptions can go from insight to published, try the tutorial and generate your first set of AI-assisted descriptions in minutes, or visit the MerchUp AI product page to see the full template and editing toolkit.
Sources
Three sources shaped the frameworks above: ConvertLab’s A/B testing guide for experiment design, Rework’s product page SEO playbook for discoverability, and Anglera’s ROI framework for holdout measurement. For a complementary tactical view, see Baby Love Growth’s product page optimisation guide.
- The Complete Guide to A/B Testing Product Descriptions on Shopify | ConvertLab Blog
- Product description writing: Shopify sales guide 2026 — Arlo
- How to measure the ROI of product data: a practical framework
- Product Page SEO for Ecommerce Growth: The 2026 Playbook


Comments
No comments yet — be the first to share what you think.